Re-centres a scale to have a defined centre / midpoint. This is the rdeck equivalent of
scales::rescale_mid().
centring an rdeck scale creates a new scale with the output palette or range centred at center.
This is similar to creating a diverging scale; the key difference is that the output palette or range
remains linear (with respect to the breaks) and is truncated on the side that is closest to center.
This is useful in creating difference layers, where the output palette or range represents distance
from the centre.
Centring vs Diverging
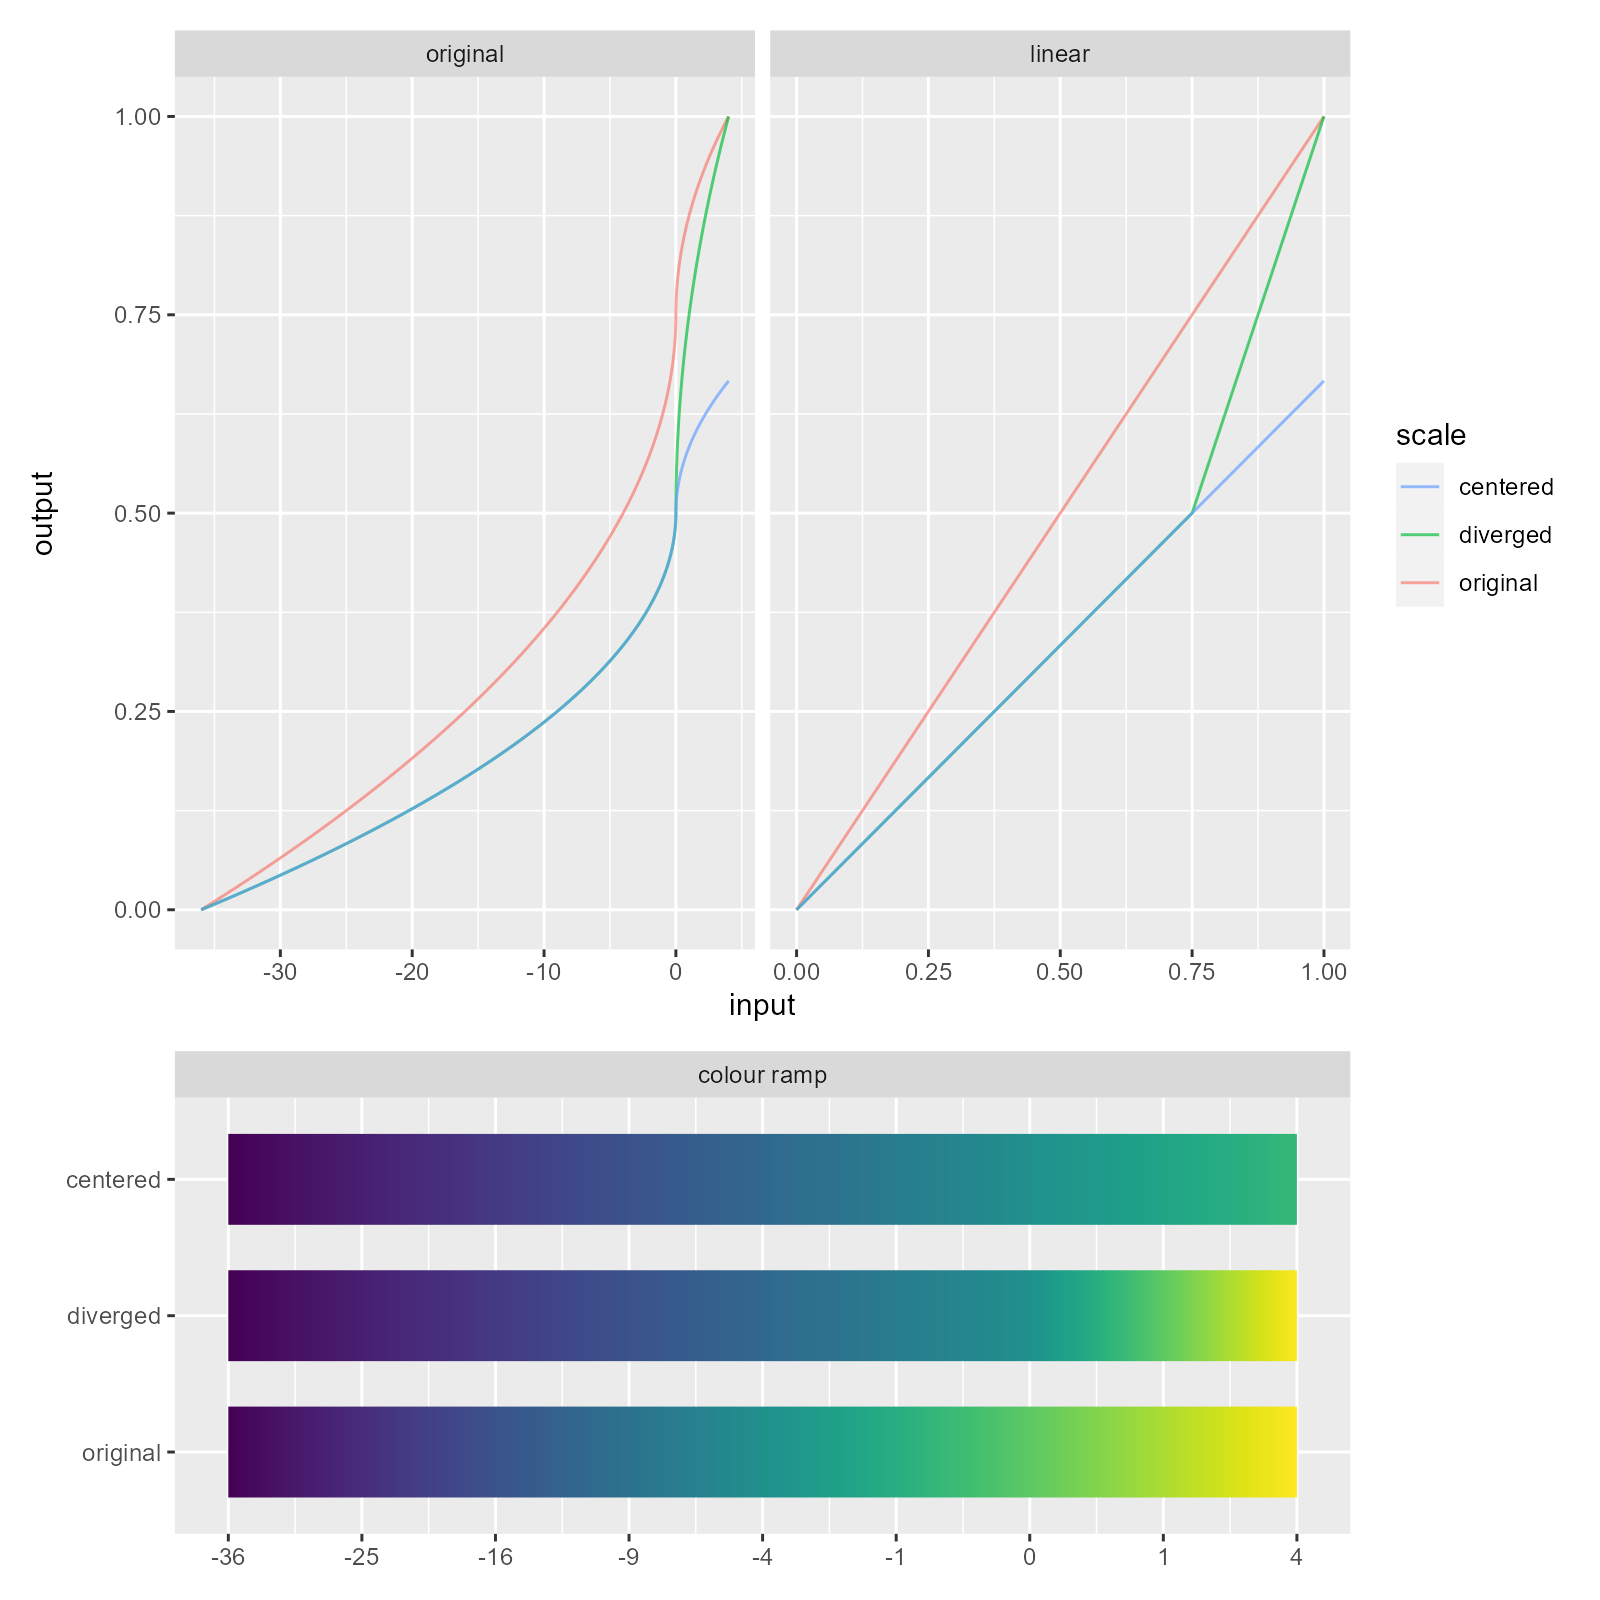
The plot below shows how rescale_center() and rescale_diverge() distort the scale output. The input
scale in this case is power_scale(limits = -36:4); this scale is centred and diverged at 0.
The plot on the left shows the mapping between the input -36:4 (x axis) and output 0:1 (y axis). The
plot on the right is a linear representation of the left and is the space that rdeck works in. The input
-36:4 transformed with power_trans() and rescaled to 0:1. This plot has been included because it's
(hopefully) easier to understand.
In the unaltered scale, we see that 0 is mapped to 0.75 in the output, which would be the colour at 0.75
on a colour ramp (e.g. scales::colour_ramp(viridis::viridis(256))(0.75)).
When applying rescale_center() we see that gradient of function has become y = 2/3x in the linear
scale, which is 2/3 * scales::rescale(trans$transform(x)) for our data. For rescale_diverge()
we see a piecewise scale with the break at center; both sides of center have a different gradient
(y = 2/3x and y = 2x - 1) and the full range of y is used.
The colour ramp plot shows the effect rescaling has on a colour palette (in this case viridis).
See also
Other scales:
rescale_diverge(),
scale_category(),
scale_identity(),
scale_linear(),
scale_log(),
scale_power(),
scale_quantile(),
scale_quantize(),
scale_symlog(),
scale_threshold()
Examples
# create a sqrt scale that is centered at 0
sqrt_centered <- rescale_center(
  scale_color_power(col, limits = -36:4),
  center = 0
)

# create a discrete symlog scale that is centered at 5
symlog_centered <- rescale_center(
  scale_color_threshold(col, limits = -100:100, breaks = breaks_symlog()),
  center = 5
)